Description
Long-term temperature development between 1953/73 and 2013
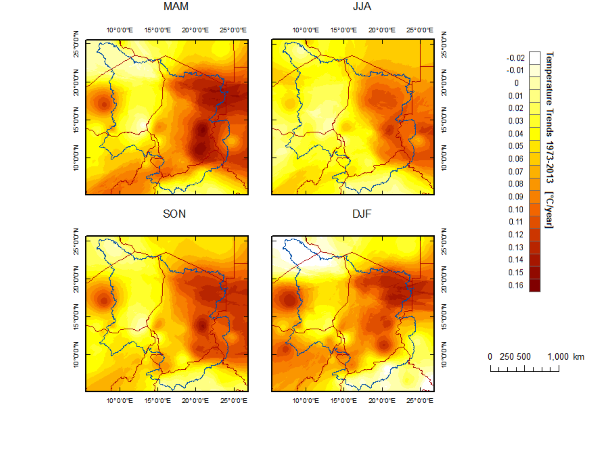
A spatially and temperorally representation of temperature development over the past decades is given in Figure 1. Trends shown in Figure 1 result from spatially interpolated daily station data obtained from the National Climate Data Center (NCDC). The results confirm the overall trends as seen in the CRUTEM data; however, the results give a more detailed impression on spatio-temporal variations of temperature change. Over the past 40 years, the eastern Chad experiences the highest temperature increase in the entire basin. Increases across the entire basin are strongest during spring and fall (up to 6°C). During summer and during winter months we see the least temperature increases (3-4°C). Along the southern basin periphery, representing the area with maximum precipitation and hence most river discharge, temperature increases are among the lowest during all seasons.
Temperature Change under different Scenarios 2000-2099
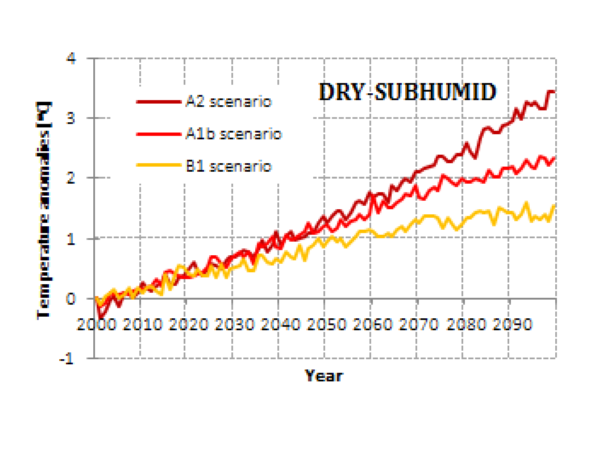
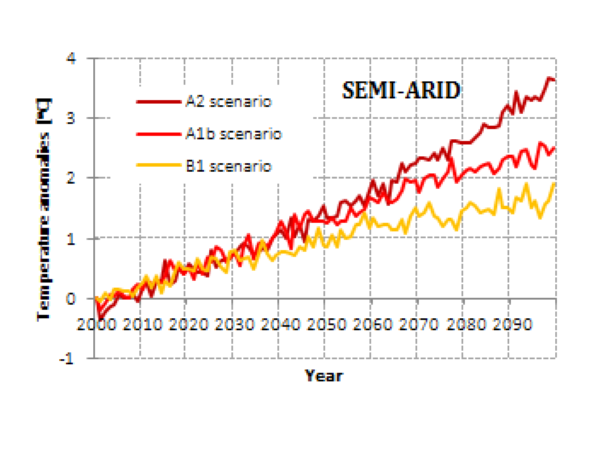
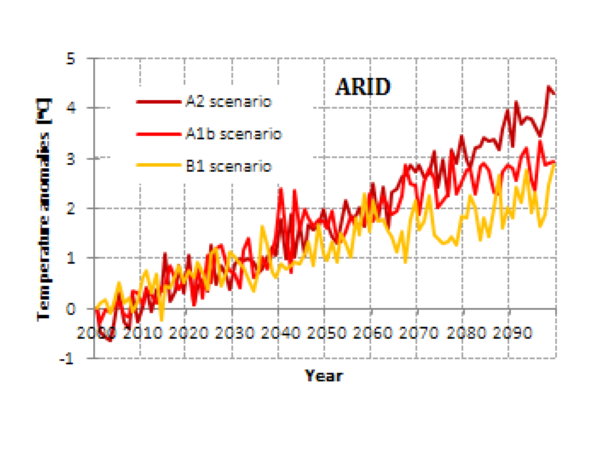
The B1 story line represents the mildest temperature increase of the discussed scenarios. In a B1 scenario, annual average temperatures will increase until the end of the century by an approximate 2°C, plus/minus 0.5°C depending on the climate zone (Figure 2 to 4). A significant difference in temperature increase between different scenarios does not occur before the end of the 2030ies. Latest at the beginning of 2040 in an A1b and an A2 scenario, temperatures will start increasing faster resulting in a total temperature increase of 3°C (A1b) and 4°C (A2) by 2099.
Temperature increase is highest in the arid (Figure 4) and lowest in the dry sub-humid zone (Figure 2). The high inter-annual temperature variation in the arid zone is related to inter-annual variations in cloud cover that are less pronounced in the semi-arid and dry sub-humid zone.
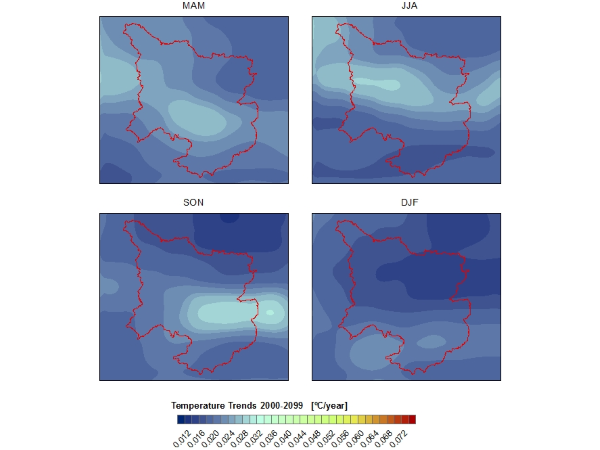
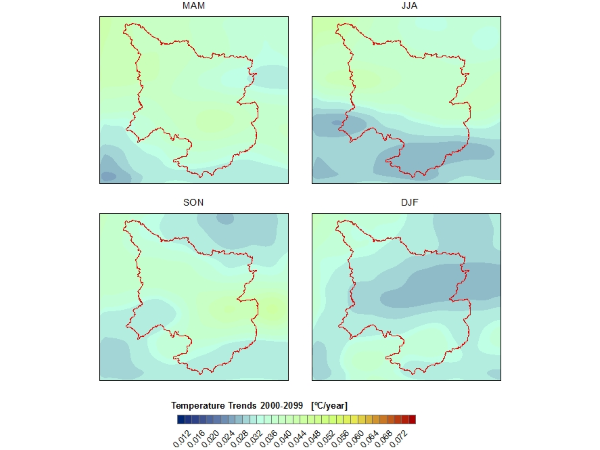
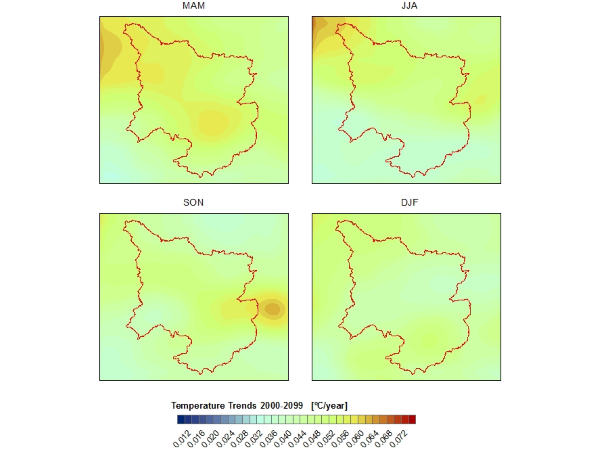
Spatio-temporal analyses of temperature development over the next hundred years (Figure 5 to 7) is in agreement with observed temperature changes between 1973 and 2013 (Figure 1), with change scenarios (B1, A1b and A2) showing highest temperature increase during spring and fall and the least temperature increase during summer (main cropping season) and winter. Areas of highest temperature increase within the water productive basin are the eastern (area of Abeche) and the central Lake Chad Basin (see spring and fall panel in Figure 5 to 7).
