Description
The temperature and precipitation distribution predominantly define the region's agricultural potential.
The Aridity Index (AI) is a parameter that allows expressing temperature and precipitation in a single parameter. The Aridity Index calculates as:
AI = Precipitation / Potential Evapotranspiration (PET).
The AI combines precipitation and temperature in one variable.
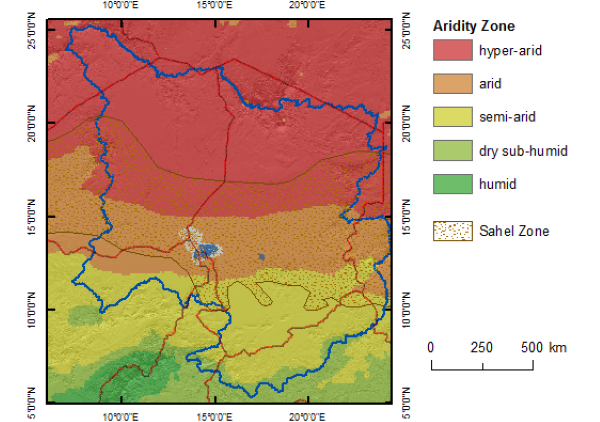
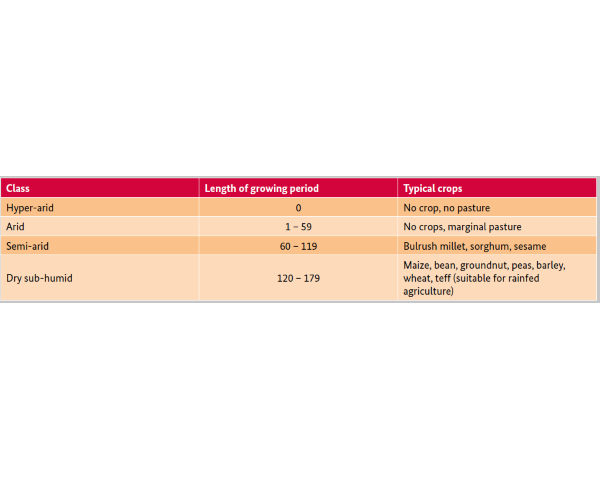
According to UNEP's classification of aridity the majority of areas in the Lake Chad Basin used for some kind of agricultural activities, fall into the arid and the semi-arid class (Figure 1). Arid and semi-arid climates are generally considered as little productive. However, to assess the agricultural potential, aridity levels based on total annual P and PET are less meaningful. Rainfall is concentrated on a few months. More important is the length of the growing period where climate conditions exceed certain thresholds. FAO (2004) gives some orientation on required climate conditions for growing different crop types (Table 1).
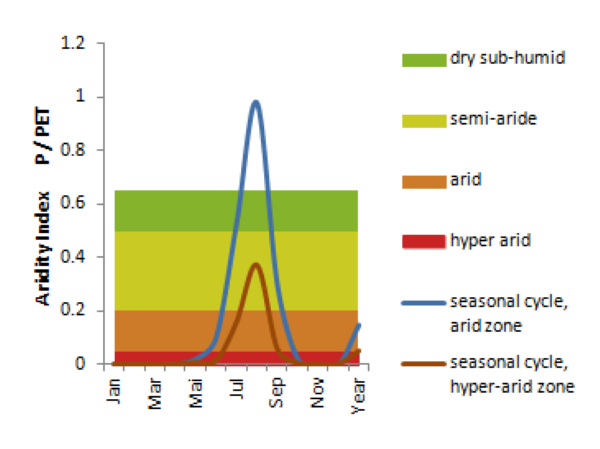
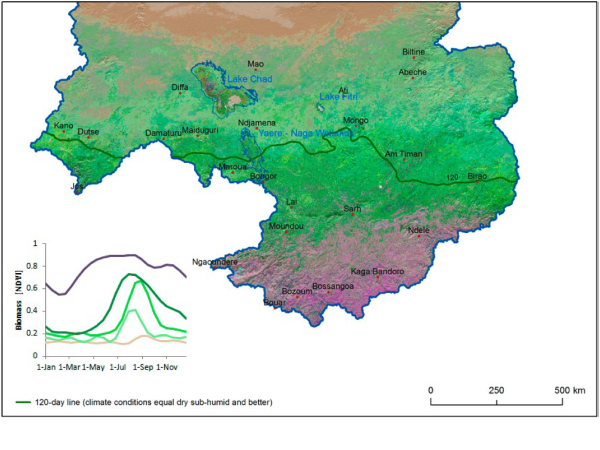
When calculating the aridity index (AI) as an annual average (An in the diagram), the AI does not even reach semi-arid conditions. This is different for AI calculations at 10-day intervals where both cycles considerably exceed the annual average for a longer period of time offering a window for agricultural activities. To calculate the length of the period with conditions that exceed dry sub-humid conditions for at least 120 days, the aridity index is calculated for every 10 days throughout a year (P10/PET10). Calculations were done on a 2001-2013 mean for precipitation and PET (Figure 2). The resulting 120-day line matches well with more intensely cultivated areas (Figures 3).
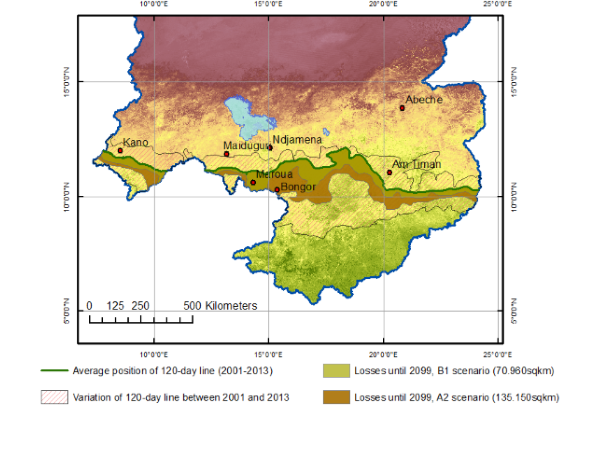
The mean 120-day line is used as a baseline against which future changes are measured. The impact of climate change on the 120-day line under a B1 and an A2 scenario was calculated as a 10-year average and at intervals of ten years from 2010/2019 to 2090/2099. By the end of the century, the positioning of the 120-day line under a B1 scenario shows a significant southward shift indicating deteriorating conditions particularly in the central basin (Figure 4). The Eastern and the Western areas remain less affected. Considering surface effects only (temperature and precipitation), the displacement of the 120-day line from its current position means that an area of approximately 70,960 km2 will no longer be useable for growing more water demanding crops, but only for crops such as sorghum and millet (see Table 1).
Under an A2 scenario, an even larger area must be reclassified to a lower agricultural potential. Because of a retreat of the 120-day line, an area of about 135,150 km2 will no longer fulfill the conditions for growing crops that are more valuable (Figure 4). A reduction of agricultural potentials of course does not only occur along the limits of the 120-day line but progressively causes an entire southward shift of potentials by a similar amount. For more details please refer to the Climate Change Study (LCBC and GIZ, 2015).
