Description
Long-term precipitation development in the LCB (1901-2010)
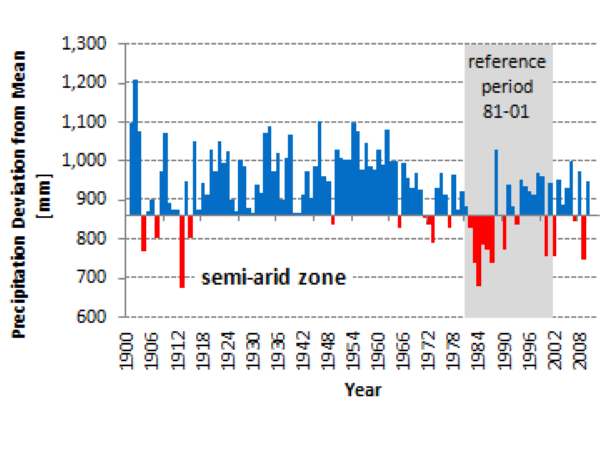
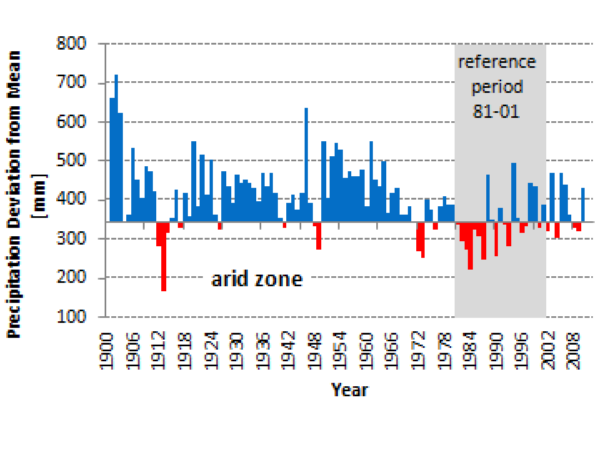
The analysis of precipitation fluctuations and trends during the last century (Figure 1 and 2) is based on pre-processed station data provided by GPCC (Rudolph et al., 2010), spatially interpolated to monthly raster data of 0.5 degree resolution. Though spatially not very detailed these data give an excellent insight into long term regional precipitation development.
Rainfall in the LCB is submitted to pronounced inter-annual rainfall variations throughout all climate zones, which-during the observed period-only became temporarily lower (more stable) during the fifties. During this decade the area received consistently high rainfall amounts. Since the nineties interannual variations are back to a level comparable to the beginning of the 20th century, however at much lower overall rainfall amounts. The high inter-annual variability makes this area and its agriculture extremely vulnerable.
Precipitation prediction in the LCB
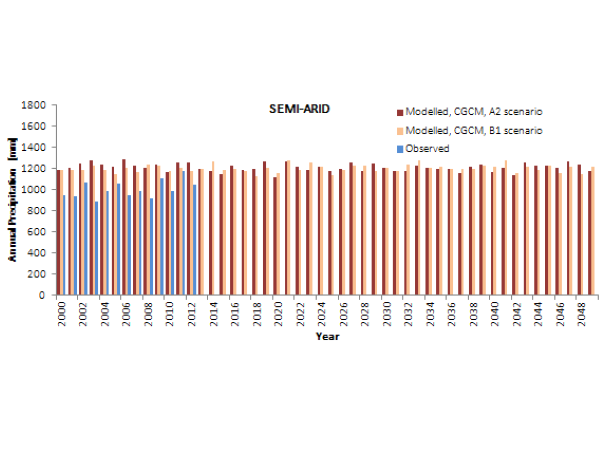
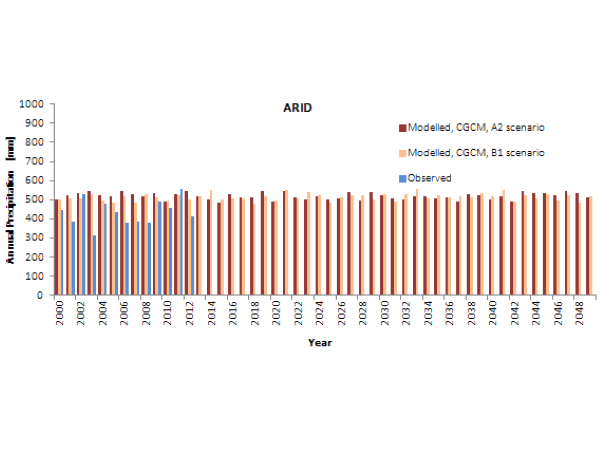
Precipitation predictions under various change scenarios are relatively inaccurate. The Canadian (CGCM) model describes average annual precipitation for the reference period in the region reasonably well; other models are either too high or too low. Still modeled rainfall from CGCM is somewhat high. Therefore, instead of using the absolute modeled rainfall amounts, relative rainfall increases were calculated and added to the observed rainfall average. All GCMs perform rather poorly in describing interannual precipitation variability. Observed data suggest a considerably higher inter-annual variability in comparison to modelled data (Figure 3 and 4). In contradiction to inter-annually very homogeneous model outputs, there is a general agreement among scientists that variability is very likely to increase under future climate change scenarios (IPCC, 2013). This view is primarily based on recent observations less so on model outputs.The poor performance of GCMs in describing inter-annual variations is a result of the models weakness in modeling SST variation (ABRAHAM et al., 2013; COOK, 1999; DAI, 2010; HAGOS AND COOK, 2007). This weakness has effects on the description of realistic seasonal rainfall variations such as modeling of "extreme events". Different to observed rainfall, showing eventual outliers even based on monthly data, modeled climate shows normally distributed rainfall across the wet, without any remarkable peaks. However, the outliers are important for triggering floods that allow rivers to spill over into areas such as the Yaere-Naga. Furthermore, caution is necessary in the interpretation of climate impacts on the quantification of hydrological parameters including soil moisture, run-off, deeper infiltration and river discharge. Still, the total available water will be less.


